Surface EMG analysis
Everything you need for sEMG-related activities
Our priority is you, the user. We care about your work on surface EMG analysis and your time as much as you do. This is why we have collected ten years worth of requests from our users and created our Three Clicks Philosophy as a response to their needs. Whatever you need can be obtained with 1 to 3 clicks. Distinguishing a signal from an artefact? One click. Analyzing muscle fatigue? One click. Creating a report? One click. Exporting numerical data to a CSV file? One click. Averaging an EMG amplitude-normalized envelope over a gait cycle among files? Three clicks. Analyzing pedaling data? One click!
EER provides you with easy-to-use powerful algorithms to support your activity, prevent you from interpreting fishy data and save your time for interpreting muscle activity. And it is available in your language.
Easy-to-use, reliable functions based on published research
EMG Easy Report processes all your data with built-in complex algorithms but you only see the results
Preventing fishy data interpretation
The software contains a graphic tool that points out the presence of any disturbances or artifacts in traces that could affect data interpretation. This is the firts step in EMG data analysis and can greatly improve your work with kinesiological EMG and clincal research!
Creating reports in MS WORD
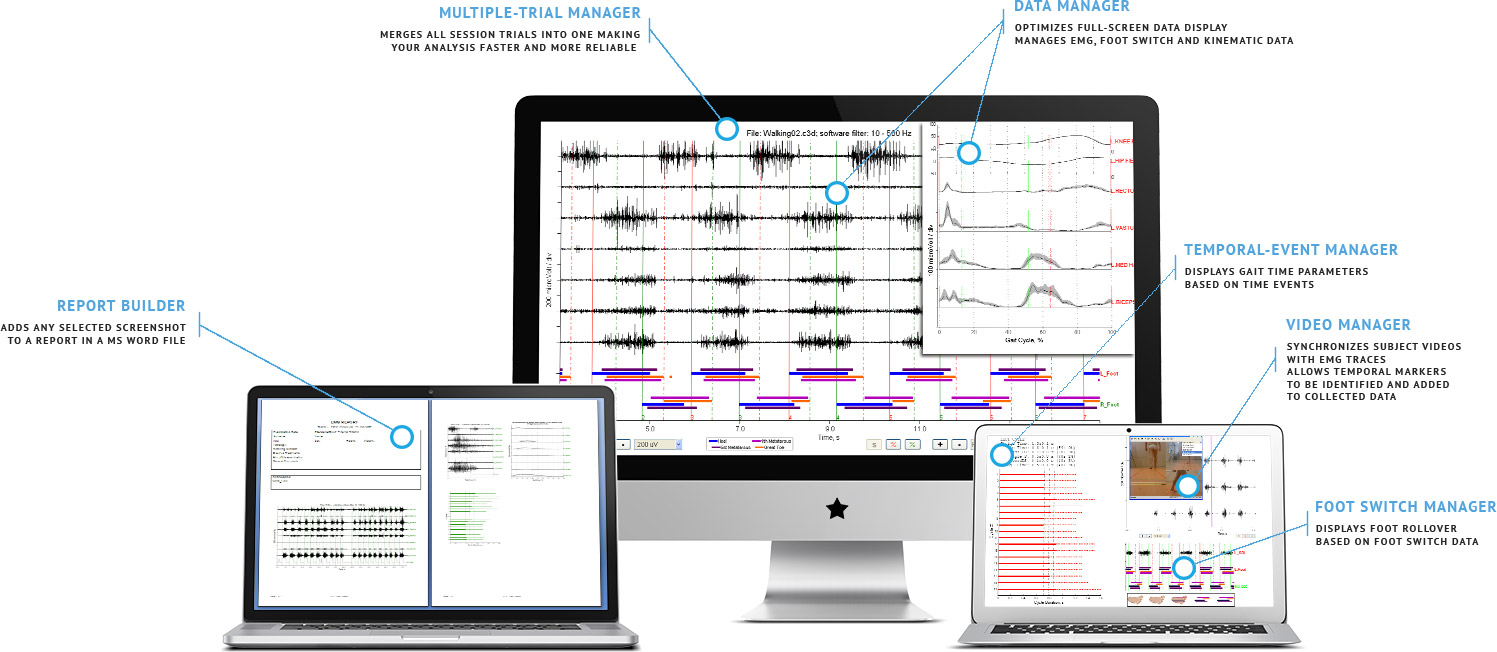
Users can create reports by inserting any subject data, images or text of their choice into modifiable files rather than static PDF files. Creating a report from a gait analysis session? One click! Adding a detail or a selected EMG burst? One click! Adding the power spectrum, a wavelet analysis, the average envelope, the muscle activation analysis? One click! Images are automatically formatted to fit into the Word ® page.
Managing temporal events
Events from different sources (motion capture systems, foot switches or walkways) can be managed and graphically analyzed. Temporal parameters from gait analysis are computed, including Stride Time, Stance and Swing Time and the duration of both double and single support phases. These are expressed in seconds and as percentage of the gait cycle duration.
Averaging activity profiles
sEMG envelopes can be normalized with respect to a reference contraction (e.g. MVC) and averaged over selected cycles to obtain a reliable activity profile. This can be used during gait analysis, sport-related assessments and research, upper limb movemens, renabilitation exercises and many other applications.
The software also has the following characteristics:
Compliant with C3D, TDF, MDX, EMG, S00 and other data formats
Full-screen data visualization
Left/right cycle management and visualization
Data presentation formats include Raw, Rectified EMG, Envelope and Taeger-Kaiser Operator visualization
Visualization of biomechanical data from various sensors (i.e. IMUs, accelerometers, goniometers)
Removal of artifacts, power-line interferences and baseline noise with high-performance filters
Data from trials of the same session can be merged to get reliable average profiles
Any part of a long acquisition can be selected and analyzed
Microsoft Word ® documents created with one click
Fully customizable Word ® document layout with user logo and data
Subject data automatically managed, when available (e.g. from gait analysis trials)
Current output can be quickly opened from within the software
Automatic formatting of all images and texts added to the Word document
Still images from videos with their corresponding EMG traces can be inserted into the output document
Graphic visualization of gait temporal parameters
Easy-to-read foot rollover visualization based on foot switch data
Amplitude, Frequency and Timing Analysis of EMG data
Computation of numerical indices for selected time intervals
Computation of mean and median cycle for EMG and biomechanical signals
MMT, MVC and Peak amplitude normalization
Time-frequency analysis
EMG density analysis
Exportation of data and numerical indices to .txt files
Exportation of plots to slides in presentations
Creation of 600 dpi pictures suitable for publication
Semi-automatic H- and M-wave analysis for Recruitment Curve Analysis


